Table of Contents
- Table of Contents
- Introduction
- Author
- GitHub
- Generating sample data
- 2 classes classification
- 3 classes classification
- Question
Introduction
I released the following article about 1 dimensional classification by supervised learning.
www.eureka-moments-blog.com
In this article, I wrote a memo about 2 dimensional classification into 2 or 3 classes. And then, I referred to the following book.

Pythonで動かして学ぶ!あたらしい機械学習の教科書 第2版 (AI & TECHNOLOGY)
- 作者: 伊藤真
- 出版社/メーカー: 翔泳社
- 発売日: 2019/07/18
- メディア: 単行本(ソフトカバー)
- この商品を含むブログを見る
Author
GitHub
Sample codes and any other related files are released at the following GitHub repository.
github.com
Generating sample data
This data is 2 dimensional sample data. The following ones are first 5 data.

This is 2 classes label data. The following ones are first 5 data.

This is 3 classes label data. The following ones are first 5 data.

This label data is created by setting 1 to only element at index in the target vector
. This method is called "1-of-K coding scheme".
The following left side figure is 2 classification sample data plot. The following right side one is 3 classification sample data plot.

2 classes classification
Logistic regression model on 2 dimension
This is a 2 dimensional logistic regression model. An output of this model is which approximates a probability
.

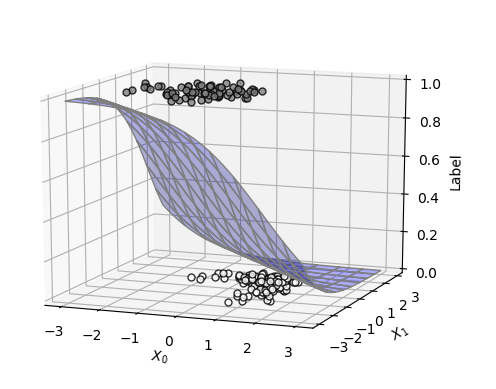
The following 2 figures are the output of this model in the case of ].


Mean cross entropy error
This following function can be used for mean cross entropy error same as the case of 1 dimension.

And then, the partial derivative of this function can be calculated as follow.

Calculating parameter by Gradient method
The following 2 figures of fitting result with 2 dimensional logistic regression model.

The parameters was calculated by "Conjugate gradient method". According to the above right side figure, an accurate decision boundary was created with those parameters.

3 classes classification
Logistic regression model for 3 classes classification
This regression model is defined with Softmax function.
www.eureka-moments-blog.com
Total input is defined as follow.

And then, by assuming the 3rd input , this formula is deformed as follow.

This total input is used as input of the softmax function. An exponential function and the total of exponential function at each class
are defined.

is the number of class. In this case,
. An output of softmax function is expressed with the above
as follow.

An output of this model is ]. And then,
. The parameter of model is expressed as the following matrix.

Each output ,
,
is expressed as a probability which the input
belongs to each class as follow.

Mean cross entropy error
"Likelihood" is a probability which all of class data is generated for all of input data
. This is expressed as follow.

The probability which all of label data was generated is calculated by the following formula.

According the above formula, an mean cross entropy error is defined as follow.

Calculating parameter by Gradient method
To calculate which minimizes
by Gradient method, a partial derivative of each
is used.

The calculated parameters is this.

The following figure is a fitting result by the logistic regression model with the above parameters.

And then, the cross entropy error is 0.26.
Question
What is an advantage of using Cross entropy error function as a loss function?